Data is the lifeblood of decision-making in the business world and visualizing this data is essential for understanding it. Combination charts offer an effective way to present data, allowing businesses to understand trends, correlations, and patterns at a glance. Read on to understand more about the highly dynamic combination chart.
Understanding Combination Charts and Their Relevance in Business
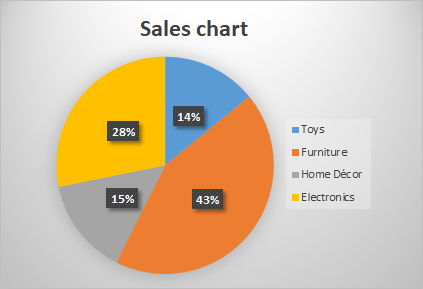
Alt text: A multi-colored combination chart.
In today’s data-driven business environment, combination charts are a pivotal tool. A combination chart is a type of chart that combines two or more chart types into one for more efficient data analysis.
Combination charts provide a nuanced understanding of data, allowing for an in-depth analysis of complex data sets. With their ability to depict multiple data series on different axes, they offer a comprehensive view of how different metrics interact with one another.
The relevance of combination charts in a business setting cannot be underestimated. They allow for a comprehensive visual representation of complex data, aiding in understanding trends, tracking progress, and making predictions.
Moreover, these charts serve as an exceptional communication tool. With their clear visuals, they can translate complex data into an easily digestible format that everyone in the organization can understand and act on.
Deciphering the Components of Combination Charts
The different components of a combination chart work harmoniously to present data in an organized, coherent fashion. Key elements include the X-axis, Y-axis, data series, and the chart types that are being combined, such as a column chart with a line chart.
Additionally, the distinct components of a combination chart offer flexibility in presenting different kinds of data. This makes it easier to tailor visual data presentations to specific business needs or objectives.
Practical Applications of Combination Charts in Business Operations
Alt text: A group of coworkers sitting at a big work desk in front of a large monitor displaying a combination chart.
Combination charts have diverse applications across various business operations. In the finance department, for instance, they can track revenue patterns, compare sales across different periods or categories, and forecast financial performance.
In marketing, these charts can be used to analyze trends, compare engagement across different channels, and monitor campaign performance. In product development and management, combination charts can offer insights into product performance, consumer preferences, and competitive analysis.
Benefits and Challenges of Using Combination Charts for Business Analysis
Combination charts hold numerous benefits for business analysis. The most notable one is their ability to present multiple data series simultaneously, providing a comprehensive snapshot of various key business metrics.
However, combination charts can be complex and potentially overwhelming to read for those with limited data literacy skills. It is important for businesses to adequately train their teams to create and interpret these sophisticated charts to truly reap their benefits.
How To Effectively Utilize Combination Charts for Enhanced Strategic Decisions
For organizations to maximize the benefits of combination charts, they need to understand when and how to use them effectively. It begins with the identification of the right data sets and metrics that can generate meaningful insights when viewed together.
Effective utilization also hinges on good design practices, using colors and shapes consistently and intelligently to reduce confusion and enhance readability. Clear labels and legends are also fundamental to ensure the presented information is easily interpreted correctly.
The strategic use of combination charts can significantly contribute to enhanced decision-making by providing a comprehensive, more nuanced view of business data.
Overall, combination charts are a powerful tool for businesses, helping them understand their data more comprehensively and tangibly. With proper knowledge and utilization, these charts can significantly enhance the quality of decision-making in an organization.